Social Media Automation Metrics That Actually Matter
Which numbers tell you whether your social media automation is working, which are vanity, and how to review them in a short weekly routine.
You automated your posting. Posts go out on time, the calendar is full, and you are saving hours. Is it working? That depends on what you count, and most dashboards invite you to count the wrong things.
This guide splits metrics into two groups, tells you which to watch, and ends with a review routine short enough that you will actually do it. It also shows which of these numbers SocialPatra puts in front of you, so you can start measuring right away.
Two kinds of numbers: process and outcome
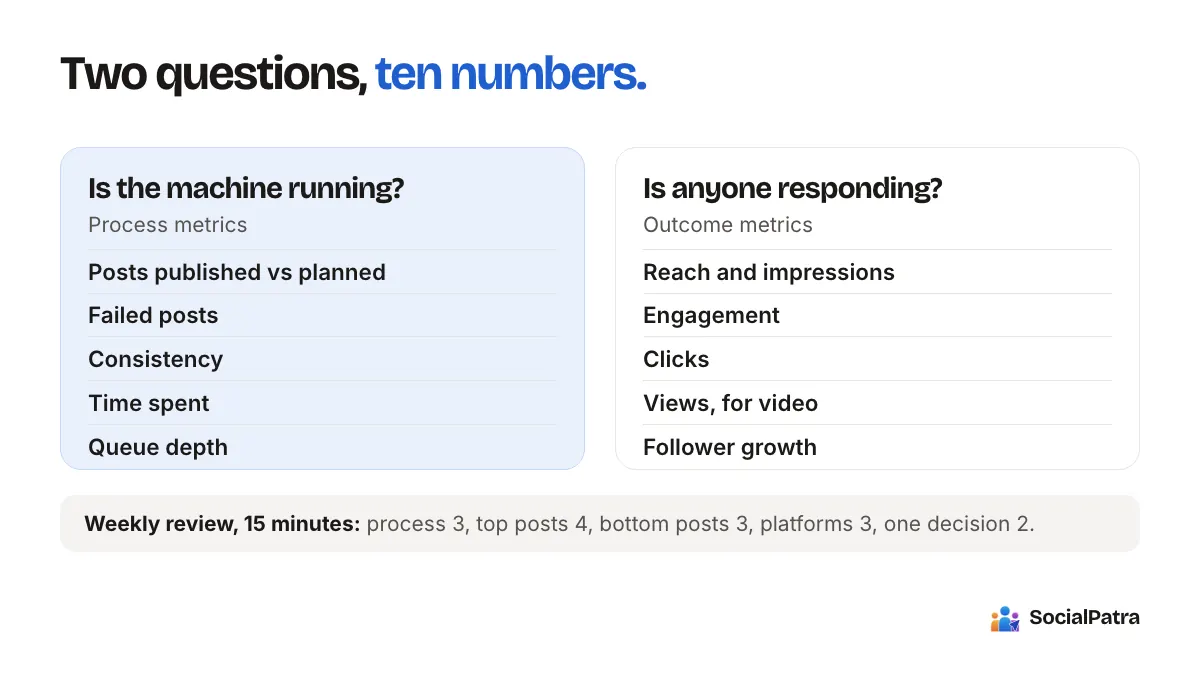
When you automate, there are two separate questions.
- Is the machine running? (process metrics)
- Is the output doing anything for the business? (outcome metrics)
Mixing them up causes the most common mistake: celebrating that 30 posts went out on schedule without checking whether anyone cared. Process metrics tell you the system is healthy. Outcome metrics tell you whether the system is worth having.
Process metrics: is the automation healthy?
These are boring and important. Check them first, because an outcome number built on missing posts is meaningless.
- Posts published vs planned. If you scheduled 20 and 17 went out, find the three that didn't.
- Failed posts. A failure is usually an expired connection or a rejected file. The sooner you see it the less it costs.
- Consistency. How many days in the last month had at least one post? Gaps defeat the purpose of automating.
- Time spent. Track your weekly hours on social media. If automation does not reduce this number, it isn't saving you anything. The ROI formula shows how to turn it into money.
- Queue depth. How many days of content are scheduled ahead? A queue that empties on Friday means a weekend scramble.
SocialPatra's analytics count published posts only by default, so drafts and posts that haven't gone out yet do not inflate your picture. Check your queue and post statuses in the app to see what failed and what is still pending.
Outcome metrics: is anyone responding?
Pick a small set. Five numbers you read weekly beat thirty you glance at monthly.
Reach and impressions
Reach is how many people saw a post. Impressions is how many times it was shown, including repeats. They tell you whether the content is being distributed at all. They say nothing about whether it was good. Treat them as a baseline for context, not a goal.
Engagement
Engagement combines likes, comments, and shares: people doing something rather than scrolling. Comments and shares are stronger signals than likes because they take effort. If your goal is community, watch comments. If it's word of mouth, watch shares.
Clicks
If a post links somewhere, clicks show who followed through. For most businesses, this sits closer to revenue than likes do. Where a platform reports clicks, SocialPatra shows them.
Views (for video)
Video views tell you whether the opening held anyone. Compare views across similar videos rather than across formats.
Follower growth
Slow and steady matters more than any single spike. SocialPatra's account insights show follower growth over 7, 30, or 90 days with the change against the previous period, for platforms that expose it.
Business metrics outside any dashboard
The metrics that pay the bills mostly live elsewhere:
- Enquiries, messages, or bookings that mention social media.
- Website visits from social, in your own web analytics.
- Sales or sign-ups with a trackable code or link.
Social tools cannot see these for you. The practical fix is simple: add a way to tell where people came from, such as a "how did you hear about us?" question or a unique link per campaign. Without that, you are guessing. Be honest about the limits: social metrics suggest influence, but they rarely prove it.
Vanity metrics to treat with suspicion
- Follower count on its own. A big, inactive audience is worth less than a small, responsive one.
- Total likes. Easy to inflate, rarely connected to a decision.
- Impressions as a goal. Useful as context, dangerous as a target.
- Posting volume. Posting more is not the point. Posting things people respond to is.
The test for any metric: "If this number changed, what would I do differently?" If the answer is nothing, stop tracking it.
What SocialPatra shows
Here is what the analytics area covers on paid plans (Professional and Business), according to the current product:
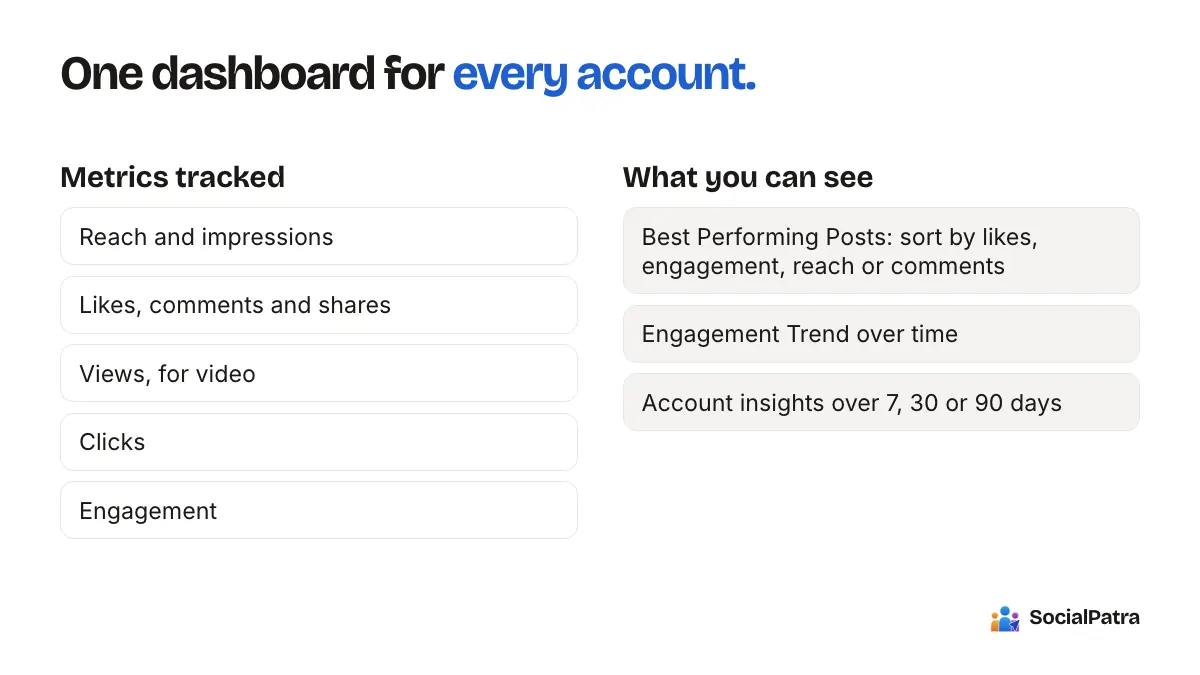
- Headline totals for posts, reach, and engagement over a date range you choose.
- A breakdown by platform, so you can compare channels.
- A Best Performing Posts view you can sort by likes, engagement, reach, or comments.
- An engagement trend over time.
- Account-level insights, including follower growth, for platforms that provide the data.
- Detail on a single post where the platform supports it.
- A Sync Now action for fresh numbers and a CSV export for reports.
Not every platform exposes every number, and the dashboard shows what the platform reports. For the full tour, read track post performance across platforms.
A 15-minute weekly review
Pick one day. Set the date range to the last 7 days.
- Process check (3 minutes). Did everything scheduled go out? Fix any failures and reconnect anything broken.
- Top three posts (4 minutes). What do they share: topic, format, time, caption style?
- Bottom three posts (3 minutes). What did people ignore? Do not repeat it.
- Platform comparison (3 minutes). Which channel earned its place this week?
- One decision (2 minutes). Write down one change for next week. Only one.
That last step matters. Metrics without a decision are decoration. This is also where automation pays back: the data feeds your content calendar and batch plan for the next cycle.
A monthly look
Once a month, zoom out to 30 or 90 days. Look at the trend, not the points. Ask whether reach and engagement are climbing, flat, or sliding, and whether the business numbers outside the dashboard moved with them. If the social numbers rise and the business numbers do not, your content is attracting the wrong audience or lacks a clear next step. That is a content problem, and no scheduler will fix it.
Agencies: report what the client cares about
If you manage client accounts, tailor the report to the client's goal rather than sending every chart. A local shop wants enquiries; a brand wants reach and sentiment. Keep each client in their own workspace so exports only ever contain that client's data, and lead the report with the one or two metrics tied to their goal.
FAQ
What metrics matter most for social media automation?
Start with process checks (posts published vs planned, failures, consistency), then a small set of outcome metrics: reach, engagement, clicks, and follower growth. Add business numbers like enquiries from your own records.
How do I measure whether automation is working?
Compare your weekly hours before and after, confirm posts are publishing reliably, and check that engagement and business results hold up or improve. Saving time while results collapse is not success.
Are likes a useful metric?
Only as a rough signal. Comments, shares, and clicks say more about real interest. Use likes for context, not decisions.
Which SocialPatra plans include analytics?
Analytics come with the paid plans, so you can see reach, engagement, clicks and follower growth across every connected platform. The Free plan covers basic scheduling for one connected account while you get started.
Pick a plan and set up your first scheduled posts, then add analytics when you are ready to measure.